Friday, April 11, 2014

The worst conference talk ever...

And how to avoid it being yours!

Huh? Isn't this blog usually about travel and merciless self-promotion?
Yes. But this entry is different. Nothing I say here is particularly original, but I'll attempt to synthesize into a shortish article containing some pointers for speakers. The subject matter is conference talks, but a lot of what I have to say applies to any public speaking event.

Communication!
A conference talk is about communication. Communication takes two parties - the speaker and the listeners. Fundamentally, you must ask yourself mercilessly if what you are doing is communication, or if you're improving the extent to which your talk is good communication.
Is my talk communicating well?

Context
A conference talk is not like a lab talk, a journal club, or a lecture course. At a conference, people working on similar or different things are getting a broad overview. In a 10 minute talk, there is not really time to give a comprehensive view. A conference talk's role is to update the audience on the state of research and knowledge, and to pique their interest to discover more. They can always find you over bagels or read your papers if they need more detail. The audience are generally professional physicists, but they know less about your field than the average peer reviewer, and that should be kept in mind.
What does my audience want to hear? What don't they already understand?

The speaking bit
Speaking is the most important part of a talk. You'd think, given the name "talk", that this would be obvious, but most people tend to treat what they say as optional ambiance for their slide show. This is a fundamental mistake. A good talk is well written and can stand on its own without slides. It could be read over the phone or heard on the radio. 

If you are not accustomed to public speaking, you should practise. A lot. Basic concepts include clarity, grammar, projection, speaking slowly, and so on. Many of the audience members will speak English as a second language, and are sitting some distance away. Repeat audience questions. Encourage the audience to wave if they can't hear. 

The content of the speech is also incredibly important, but often neglected. Many speakers read their slides. Words cannot convey how wrong this is. A speech should read like a pithy, preferably witty essay or short story. Given time constraints, it pays to think carefully about what you want to say, construct a compelling narrative, use evocative language, and synthesize ideas and concepts with the central topic regularly. Unless your results are perfect, acknowledging shortcomings with self deprecating humour is usually a plus.

Is it easy for people to listen to what I'm saying? 

Presentation
Comb your hair and wear nice clothes. People should feel comfortable looking at you and your face - it's very important for communication. Similarly, room lighting should be bright enough for people (even ancient professors) to read fine text. A lot of the conference is about networking and recruitment.
Dress up for a job interview or better.

Slides
This is by far the most abused part of conference talks. There are many ways to screw it up. Fundamentally it comes down to communication. A sequence of slides is great for telling a story with a strong sense of chronology, so write your talk accordingly. A sequence of slides is terrible for illustrating connections in complicated systems, so be careful.
Does my slideshow actually contribute to my talk?

Quantity of slides
If you try to split a paper or thesis up into a slideshow, you will have too many slides. As a general rule, one slide per minute of talk is about right. Less is fine. More is definitely not fine. If you have difficulty fitting your 10 minute talk onto about 10 slides, the answer is not to make your figures smaller. Break your talk up into 6-8 key concepts or results, and have a slide for each.
Does each slide actually add substantially to the whole?

Use of slides
What are slides good for? People can speak and listen more quickly than they can read, but a good diagram speaks better than thousands of words. As such, slides should be used almost exclusively for diagrams, figures, graphs, plots, and so on.
Is each element of my talk contributing the best it can?

Slide dos
Do use big diagrams. Do label diagrams appropriately. Use labels rather than keys, label axes, title graphs. Title each slide with a short, pithy, and specific label. Keep it simple. You can always answer a question with overwhelming detail and erudition.
Is my slideshow an exercise in communication?

Slide don'ts
Don't use bullet points. Especially don't use hierarchical bullet points. Don't use 'introduction', 'conclusion' or any other generic term as a slide subject. Don't use block text. Never read text on the slide.
Have I done anything which will make the audience want to shoot themselves or me?

Good figures
There are many resources on the art of making good figures. But in general, you know a good figure when you see one. Colours are used to transmit information. The colour palette should be chosen so that colour blind people won't be too confused. Diagrams and graphs should be devised to be as simple as possible. Axes should be clear but unobtrusive. Information should be dense. The most important basic information should be immediately obvious; subsidiary detail should not dominate the figure. Tables are better for small data sets. The take home message should be obvious. A figure might require explanation - that's why you're there, and that's okay.
Is my figure a work of art?

Lolcats
Visual punctuation is important, especially for didactic talks. If you want people to remember things, a change of tempo is a good idea. Eg "lolcat says always check your dimensions" is a lot more memorable than anything else. That said, overuse cheapens the effect and shouldn't be necessary at all in many contexts or with a sufficiently well written speech. Be aware of political correctness when executing any naughty jokes.
Am I comedian? How do I want to be perceived? Will people tune out?

Title slide
The title slide is important, since it'll sit there while you're being introduced. It should have a relevant figure on it, preferably enticing and visually stimulating. It should also contain the title of your talk, your name, your collaborators (be inclusive), your institution, and the conference you're at. This is to remind you what you're talking about, and to help you check you have the right slide show. A double title slide is a trick where you have two nearly identical cover slides. While you're being introduced you can switch between them to check the show is working, without distracting the audience too much.
Is my title slide a throwaway? Is it worthy of the subject matter?

Audience participation
Audience participation is generally a good thing, as it promotes engagement. The best talkers regularly pepper their talks (especially longer ones) with anecdotes and refer to people present in the audience, and even ask questions (especially in a lecturing context). When I'm giving a lab talk, I usually start by polling everyone in the group on their knowledge of the topic. It generates a framework. In the context of a conference talk, asking people to raise hands if they can hear you, especially if you prefer not to use a microphone, is a great way to turn their brains back on after hours of semi-comatose sitting. If your talk concerns something of a mystery, getting people to take a guess at a unknown result is also a useful way to engage. Eg "Show of hands who thinks the Higgs mass is between 120 and 130 Gev?" In a smaller seminar, get and keep everyone talking.
Do I have any evidence anyone is listening to me?

Lasers
Never under estimate the importance of lasers. Technically, you should be able to give a talk without a laser, but I find it's much more fun to secretly have a laser pointer capable of de-orbiting the space station. It helps to foment a feeling of awe in the audience. You can also claim its astronomical cost against tax. On the other hand, if you ever point it anywhere except the slide, you're an asshole who is gambling with people's vision.
Can I afford a bigger laser?

Flexibility of presentation
If the talk before yours introduces the same material and it's the same audience, skip your introduction. There is nothing worse than hearing "Professor Y spoke about this, but it's on my slides, so I'll go through it again anyway". There is nothing better than saying "Thankyou Professor Y for introducing my talk so well, this diagram is exactly the same as blah, next slide". If someone asks a good question during the talk, change the talk as necessary. Have spare diagrams at the end of your talk that you can jump forward to if you need to.
Is my talk structure more important than its purpose?

Audience etiquette
So now we know what makes a good show. How to spread the word? What is the best way to stage an intervention in a terrible talk? Some people walk out. Some people openly criticise. Some people play guerrilla laser tag with their laser pointer. Unfortunately I do not have any answers for this. But at least every time you see someone do something silly, you'll know not to do that yourself.
Is my life long enough to put up with this affront to informational aesthetics?


Sunday, April 6, 2014

Long lost blog update

So I haven't done anything hugely spectacular since new year. But I've done a lot of smaller things, which I'll attempt to summarize now!

Flying! I've been learning to fly. It's taken a bit longer than I expected, due to being busy with everything else. But here are some photos from my various cross country solo flights:

Australia! I went to Australia in late January to hang out with family and show P the sights. One highlight was a tour of the Town Hall organ. Photos are here: https://picasaweb.google.com/105494084231616659850/Australia2014

Mars stuff! Some of my friends are involved in driving robots on Mars. One of them recently took this awesome panorama looking out at the crater walls.

Full size: https://www.flickr.com/photos/106629967@N06/13652263093/sizes/o/

3D printing! I've been spending some time 3D printing things. This is a 3D model of 12 DNA basepairs. Spheres proportional to atomic size. 100,000,000 times actual size.

Sunday, November 17, 2013

Mexico 2013 field trip


I was thrilled when I found out that the Fall 2013 Ge 136 field trip would be going to Baja California again. Regular readers will know that this is my favourite class by far. I have now done it 6 times. In fact I have done it so much that we're beginning to repeat material. For grad students like myself who lack a car, time, and silliness, the field trips are a perfect opportunity to find out about the land from those who know it best!

The previous trip to Mexico occurred in November 2011 (http://caseyexaustralia.blogspot.com/2011/11/ge-136-field-trip-to-baja-california.html), and was the last time my old camera and lasers worked properly. There was a violent rainstorm that caused everything to get wet! The forecast this time was somewhat better. 

Thursday evening. I stumbled out of a class on matrix beam theory and, collecting my gear, headed for the trucks. Lined up gleaming in the dark purple twilight, each had a full tank and an empty trunk, but not for long. The TA H had allocated me as the driver of all the undergrad girls. Punishment or reward, I wasn't certain.

We hit the road. After an hour we emerged from the traffic jam and, cruising south on the 610, made it to the campground near the Tecate border crossing in just under 4 hours. My gamble with the route had, for better or for worse, had no effect - we arrived within 5 minutes of everyone else! I ditched my bag on the party tarp and sat around the campfire. By 10pm, Jupiter had risen, so I cracked out my binoculars and showed people the moons. Three were visible as specks of light around Jupiter's impossibly bright disk. The moon was also visible and cratery.

Aware of the long drive the following day I headed to my luxurious bed - a blanket folded over 3 times under my sleeping bag - leaving the rest of the class to tend the fire and their collective raging thirst. As something caught fire, the leaves above me twinkled in reds and oranges.

During the night, I woke with a start. A roaring sound and the earth shook. Leaves fell from trees - could this be another earthquake? I sat up and looked around. I was surrounded by dark seal-like sleeping bags on the ground. Then the roaring started again. Someone was snoring next to me. I lay back down and strategically accidentally-on purpose sleep-kicked them, and they rolled over. Crisis averted.

I was greeted by a bright clear morning. I retrieved my supply of naan bread and quickly warmed it over the gas cooktop. Sunnies firmly in place, we convoyed to the Mexican border and drove under a boom gate. Ten minutes later we were outside Tecate on the open road. The road snaked between massive outcroppings of boulders. The mountains here are the eroded roots of a batholith, an exhumed granite mass of rock. Periodically we stopped for talks, and before long we had sped to Ensenada and Cicese, where we resisted the pull of roadside stalls and picked up O and J, two geology students from the University of Baja California. To the south of Ensenada, Punta Banda sticks out into the Pacific Ocean. A narrow spit of land broken out from the peninsula and thrust to the west, it has some particularly excellent rudist remains, as well as a series of paleo sea terraces. But today we were not going to Punta Banda, we were going to its mother fault, the Agua Blanca fault. Lunch was set up, and people took photos of the picturesque mountain range. At some point someone said 'that's an interesting off-set'. Indeed, the mountain featured a series of straight v-shaped valleys which abruptly kinked near the base, marking the location of the Agua Blanca right-lateral strike slip fault.

Punta Cina looked like an unlikely bet. There's a fabulous fossilized reef being turned into cement in a factory, and the owners are less friendly than before. Fortunately our Mexican guests knew of another exposure in a canyon behind the next campsite. We cruised south toward Santo Tomas, site of the oldest vineyard in North America, started by Franciscan monks as part of their perhaps well-intentioned and certainly highly effective program of cultural and racial obliteration. We struck out towards the coast and our first campsite. 2 years ago, it was under water and I didn't see that much of it. This time though, gently rolling plains swooping down towards herds of cattle and the sea. We stopped by a lighthouse for some talks, then proceeded to our camp site. 

A quick scramble down the sea cliff and we were on the beach between gently sloping cretaceous sediments and the gentle waves of an ebbing tide. Of course the cretaceous sediments contained more than a few fossils (though you'd have to know what to look for), giving a real insight for how the environment changed over a few million years as we walked down the beach. Generally speaking marine deposits shallow over time as more silt accumulates, however subsidence or sea-level changes can rapidly change the character of species and even the rock type in one strata. I even managed to skim a few chunks out through the breakers, though missed the seagulls in the process. Half way up the sea cliff is an cretacious-paleogene unconformity. Though there are a few tens of millions of years missing, somewhere in between the dinosaurs died out. Today this gap is marked by a narrow ledge, covered with the seabird descendants of the only surviving dinosaurs. Even better, the next bay has a few hadrosaur ribs here and there...

That evening we had a fire constructed, fold-out chairs deployed, and mountains of the only appropriate dinner (pasta) duly produced. I was feeling slightly skittish, so took my camera and tripod up a nearby hill to take photos of the camp and so on with long exposures. My plan was to capitalize on the excellent stars and produce my first all-sky night-time panorama, but unfortunately some clouds blew in and the setting moon washed everything out a bit. Still, I found a nice cactus to sit the camera on. After a few minutes as my hill-climbing heat leaked away, I heard the youthful voices of some undergrad friends making their way up the hill. We took a few photos together and I headed down. At about that moment some fog blew in, but my friends were determined to finish their climb without lights. Soon after their absence was noticed, which caused quite a lot of excitement. But half an hour later around the campfire, all (and then some) was thoroughly forgotten.

I found a stretcher in the back of one of the trucks and, setting it out on a nice flat patch, curled up inside my sleeping bag as the stars ground past overhead and, occasionally, a shooting star shot across the sky. Fortunately, there were no tremors that night.

The next day I took myself out of my sleeping bag, my trousers out of my sleeping bag bag, then placed myself in my trousers and my sleeping bag in its sleeping bag bag. This is not as technical as it sounds. Soon I was packed, eating breakfast, and running around like a epileptic monkey with my camera.

The convoy headed for the homestead, where we met the ranch owner, admired his collection of derelict cars, and headed for the canyon upstream, where, legend has it, an ancient coral reef is exposed between rocks with pouring water. We made our way up canyon, climbing up several waterfalls and balancing on logs across muddy springs until we popped out in the head of the canyon, finding a cave full of ash and rat droppings. In the roof of the cave was preserved the shells of rudists, ancient reef-building clams that died out a long time ago.

Next stop was a rock outcrop to the south. Strata dipped at 30 degrees, with a thin layer of limestone preserving several excellent fossils of coral. Above and below, volcanic ash. Indeed, 100 million years ago, these rocks were the shores of a volcanic atol, and we even found chunks of reef broken off and entrained in basalt lava flows.

Soon after we found a beach highly worthy of a long lunch break. Long mainly because two of the vehicles became stuck in sand, providing much mirth and hilarity in between a short dip in the rather fresh ocean to provide some free space for fresh layers of dirt to accumulate. From here the road continued along the top of a precarious cliff and we, now radioless, drove south to San Quintin, where we parked behind a sand dune and ferried our camping gear to the top of the hill. 

Once again a fire was duly lit, only to realise that we were perilously low on firewood. After a stunning dinner of tortillas with enough left-over rice to keep hunger at bay for whole hours, I went for a walk down the beach to find some wood. I returned with a respectable bundle of sticks, only to find in my absence an enterprising geology grad had sourced a few palettes, which, for the record, burn really well. Later this was augmented by a half dozen tree stumps, for the best camp bonfire I've ever seen. Initially there were about 8 of us on our knees around the fire pit, close enough to high five over the top. By the end, we could have sent signals to Mars.

Then it was time for the shovel-olympics. Being errant geologists, we had no fewer than four shovels. 7 nationalities were represented, though sadly, as always, I was all alone representing the southern hemisphere. The with a large representation of Americans, there was a few defections, in particular to China. The events consisted of shovel javelin, shovel discus (which was more like shovel evasive action), digging a hole, dizzy shovel (shotgun a beer, run around shovel 10 times with face on shovel, then run to the water and back), shovel limbo, and shovel possession knockout. I even remembered to fill in the holes afterwards so noone died.

Next morning we packed the vehicles then prepared for our most distant talks. Just behind the dune was a microbial mat, one of the more ancient types of environments on earth, today preserved only in saline environments. Consisting of bottomless black ooze topped with a 1mm thick rainbow layer of living phototropic bacteria, it's one of the most productive biomes (in terms of biomass accumulated) in the world. It's also thought to be one of the main mechanisms by which oil is generated. My foot-width to height ratio was just high enough that I could walk across the surface without punching through the crust, but many people punched, and some punched gloriously, sinking to the waist. S attempted a body slide, with scratchy results. 

Soon it was time to head back, with only one more stop along the way. We drove down a wash towards a small but pretty beach, a few ramshackle houses dotting the hill above. On the right, a layer of soft gray sediments was topped by a hard red conglomerate. Nearby, the grey contained ammonites, and the red contained shock-quartz, generated by a meteorite impact. A short erosional unconformity, but otherwise a perfect place to finally give my talk on radioactive space rocks. 

Nearly all rocks are made of minerals with oxygen. Oxygen comes in three stable varieties, of respective atomic weights 16, 17, and 18. The 16 isotope is MUCH more common, so looking at the ratio of 17:16 and 18:16 is illustrative. The relative concentrations get moved around by mass-dependent reactions and symmetry-dependent reactions, forming discrete regions. Different space rocks start out with different amounts of oxygen, because oxygen is made in old dead stars and spread into space on grains of dust and as gasses, and each planet is made of different amounts of gas and dust, so each planet and asteroid family has a different root composition. Put together, you can work out where any meteorite came from. For instance, a thin layer of clay around the world at the K-Pg boundary is a mix of about 90% destroyed coral reef and 10% meteorite that wiped out the dinosaurs, except birds. By counting how much space-rock is in that layer, we can estimate that the relevant asteroid was about 10km in diameter. That sounds small in comparison to the size of a city or even a marathon, but remember that when its face touched the ocean surface, its tail was still in the stratosphere. There's also a growing family of meteorites that are recognised to have come from Mars. Magnetic analysis tells us they never got hotter than 50C or so either during ejection, flying through space, or Earth atmospheric entry. Cosmic ray analysis says they were in space for a few hundred thousand to a few million years. In other words, even today Mars rocks are raining down, and in the past, many, many more would have, more or less guaranteeing that if life originated on either planet, it could now be on both. I think that's cool!


Concerning Mars, MAVEN, an atmospheric satellite is going to Mars in the next few weeks. It's going to try and figure out what happened to Mars' atmosphere. We know it used to have a thick, wet, warm atmosphere, but it's been lost. Either it's frozen out on and in the ground, or it was blown away by the sun. Both are possible, since Mars lacks a large magnetic field (though it certainly once had one). It's thought Mars was warm and wet until 3.8 billion years ago (with possible short warm periods since), while for comparison the earliest life on Earth was 4.2 billion years ago. It's possibly Mars lost its magnetic field, then enough of the atmosphere blew away to start a run-away icebox effect. Of course, the Sun is about 25% hotter today, so maybe we could reverse that effect. My personal suspicion is that oxygen producing microbes evolved on Mars, as they did on Earth. On Earth, the oxygen oxidised minerals on the surface until saturation, producing the banded iron formations. Tectonic and geologic activity ensured a large supply of oxidizable rocks, but eventually things saturated about 2.4 billion years ago. The atmosphere lost much of its CO2 and methane as microbes poisoned themselves with oxygen, and in the process, a lot of the greenhouse effect. Earth went through several phases of mass glaciation, known as snowball Earth, because a nitrogen oxygen atmosphere is not as warm as a CO2 heavy one. My personal opinion, completely unsupported by evidence, is that the same process occurred on Mars, but it occurred faster. Mars has geological processes, but they're about a million times slower. As a result, the time taken to oxidize minerals at the surface was much shorter, at which point the microbes effectively punched large heat-windows in their own atmosphere and froze to death. Unlike on Earth, there wasn't enough time to evolve oxygen-using microbes that could exploit the oxygen and stabilize the atmosphere, at least, not on a planetary scale. We shall see.

But, I digress. We loaded the cars and headed back to the road. K copiloted and provided conversation to keep me awake. In return I tried to teach her to solve a Rubik's cube, with the added complication that I was unable to see it. But we nearly got there.

We spent only 1.5 hours at the border waiting to get through. Fortunately our car had a nice guard who wasn't too mean, but some of the other cars were flashlighted rather aggressively. Then onto the main road, a brief stop in Temecula In 'n' Out, and zooming back to Caltech on the 15.

As always, an extraordinarily fun, rejuvenating weekend.


Thursday, October 10, 2013

The Tesla Model S: What's all the fuss about?

Published in the California Tech October 7 2013


Model S in Silver, Desert Road


The Tesla Model S: What's all the fuss about?

Casey Handmer


Push the accelerator. Feel the power tilt you over and suck your eyes into your head. In complete silence. Electric cars are the future, and in Tesla's revolutionary Model S, the future is here.


For those who live under a rock, Tesla has successfully brought their second generation sedan to market. Sleek, slippery, sexy, and stuffed with semiconductors, it may finally be the computer industry's answer to Detroit.


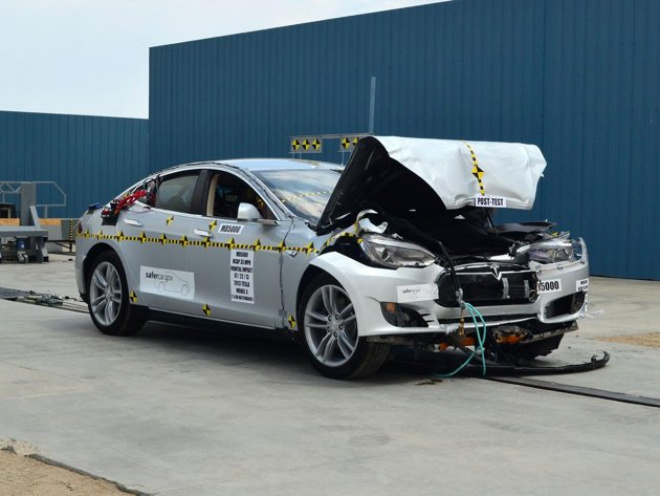
Tesla's CEO Elon Musk gave the Caltech commencement address in 2012. In case you forgot, he mentioned that in building the Model S, Tesla set out to create a car that was superior to its competitors in every way. One year later, it has scooped three major industry awards; Car of the Year from both Automobile Magazine and Motor Trend. The third was self-awarded, when an analysis of their test results revealed the Model S was the safest car ever tested by NHTSA.


Whereas most other electric cars on the market are glorified golf carts with all the performance and allure of Caltech's own electric fleet, Tesla somehow managed to optimise in the opposite direction. An analysis of this achievement is illustrative for anyone with an engineering or problem solving bent. Indeed, in proving the naysayers wrong Tesla finagled a short squeeze of their own stock, enabling a follow-on stock offering and the raising of an additional US$1.1b.


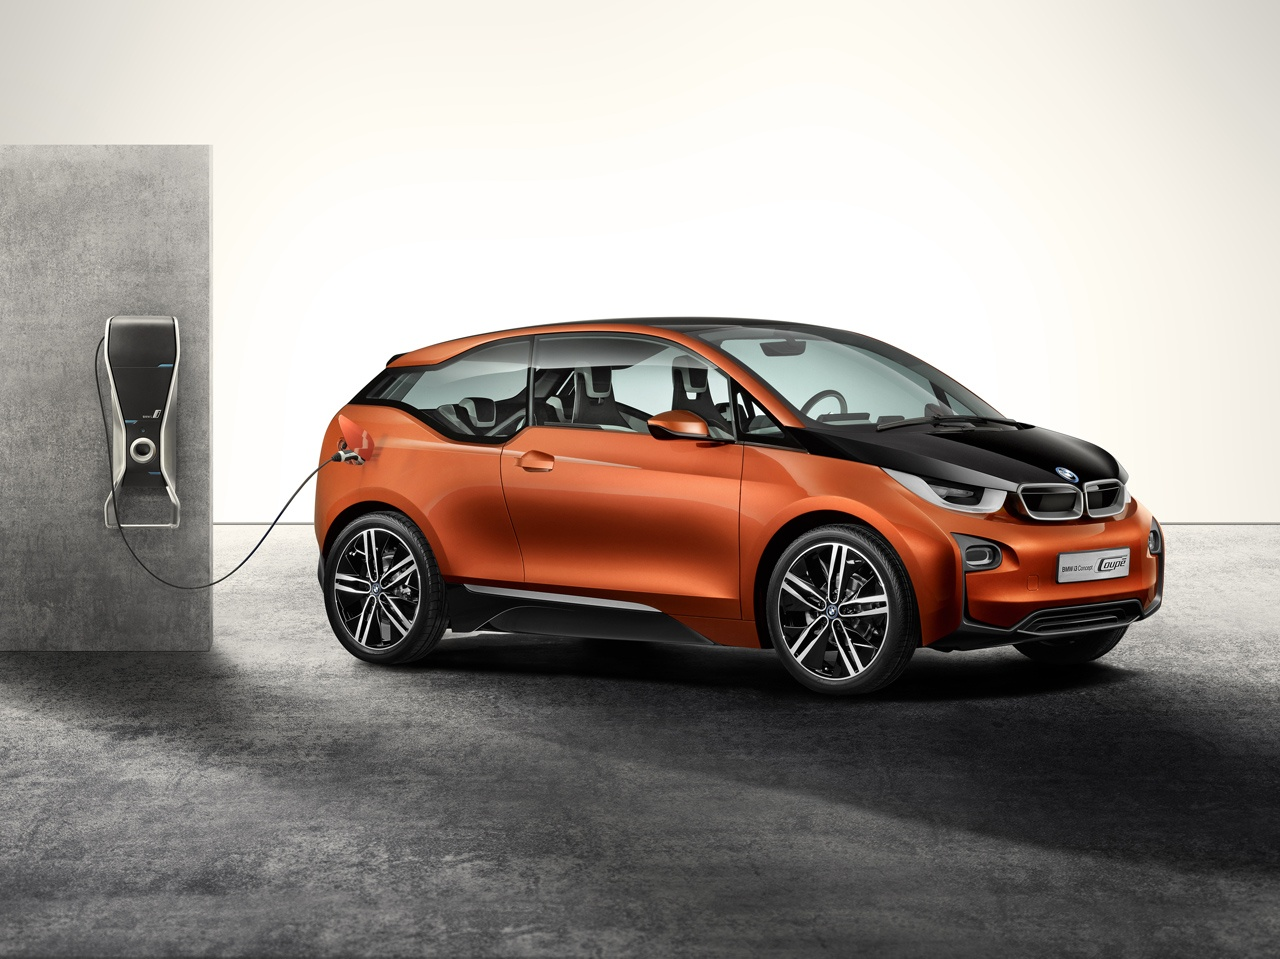
The most prominent electric car released since the Tesla is BMW's i3. While its carbon fibre chassis does feature some reasonably innovative ideas, its styling is an echo of the pre-Tesla era. All car manufacturers that operate in the United States have to deal with interlocking state-by-state compliance issues of Byzantine complexity.


One of the most effective is California's requirement that a certain number of electric cars be produced, presumably to spur technology development by reluctant and largely calcified giants that only 5 years ago required taxpayer-funded bailouts to remain solvent. The general response to this was to produce a series of cars of underwhelming utility, price, and attractiveness. Unsurprisingly and, indeed, by design, these cars have not sold well, despite aggressive and loss-inducing cuts in price.


After the compliance car program ran its course, it is a safe bet that industry lobbyists would be parroting their 'market has spoken' mantra, with dismal sales figures across the board suggesting that California's absurdly green and possibly communist electric car policies be repealed. In case the crummy range and worse performance of these mostly compact conversions wasn't enough to do them in, designers gleefully decked them out with a variety of gag-inducing styling decisions. No doubt this appeals to the particularly hard-core Hollywood advocate types, in that owning one of these cars (the Mitsubishi iMiEV comes to mind) is incontrovertibly honest signalling that you are very, very serious about the environment.
Can you imagine being a recently graduated engineer assigned to work on one of these hopeless Potemkin car electrification projects? I wonder how many of them were caught vainly licking the terminals of a 400V battery pack.


When the Nissan Leaf and Chevy Volt were designed, Tesla was a peculiar Silicon Valley venture producing a few hundred fast and quiet Lotus Elises (the Roadster) a year. In 2008 they laid off a bunch of people and nearly went out the back door. At best, a curiosity. By the time BMW sat down with their designers, Leaf and Volt sales data all but confirmed that the consumer wasn't biting. All that was needed was an unsuccessful offering from one of the most respected manufacturers in the world, and by the end of 2014, these cars would be nothing but a footnote in a book about unsuccessful meddling in the free market.


I can almost imagine a meeting amongst the BMW i3's product development people. Someone who's new on the job asks "But what about the Tesla WhiteStar?". The room erupts in laughter. The Roadster was out of production. A few rumours swirled around robots in the old NUMMI plant. Tesla stock was the most shorted on the exchange and lurched unsteadily ever lower. The CEO was rambling about launching rockets, but so far had mostly only blown them up. Even people signing parts supply deals with Tesla were buying good insurance and snickering behind their hands. Several respected automotive industry analysts had predicted that Tesla would produce no more than 3000 cars, before inevitable problems, glitches, and perhaps a fatal fire or two would trigger the final death spiral.


If I had to guess at what point the phones started ringing, I would guess May 8 2013. Tesla had forecast a profitable third quarter. Instead, the sale of emissions credits had pushed it over the line in the first quarter. Within days, panicked hedge funds had tried to close their short positions, and a deep lack of share availability had pushed the price up by a factor of three. Suddenly Tesla went from 'the next Solyndra' to 'the next Apple'. As the cars became more available (nearly 20000 have been built to date), competitors' engineers would have got their hands on one and finally seen what they were up against.


At BMW, it was too late. You can tell their i3 launch promotional material is hastily redesigned to be as forgettable as possible. Industry blogs changed tack from 'when will Tesla finally declare bankruptcy' to 'Tesla's competitors hot on their heels'. As we shall soon see, Tesla has already set the standard. From here, they have only themselves to beat.


Against this maelstrom of chaos and confusion, two prominent car makers have been relatively calm and collected. Daimler and Toyota both bought stakes in Tesla during its years of perdition, and both have now produced unoffensive though unspectacular cars using the Tesla drive train. From here, Tesla's aggressive roll out of supercharger technology could well mean the creation of an ecosystem which will become the defacto national standard. Provided they suffer no major missteps, theirs is the market to dominate. Friendly manufacturers like Toyota and Daimler can exploit their business relationship and leverage their access to superior technology, while their competitors face a more stark choice, between participation by licensing at the market rate or an inevitable slide into obsolete irrelevance. A third option, aggressive innovation and competition, is also possible and, broadly, a desirable outcome. Either way, Tesla's aim of creating and aggressively growing the electric car market is assured.


At this point I should mention that Hyundai's strategy for sustainable transportation was through research and IP development in hydrogen fuel cells. Battery technology was better than hydrogen could ever be four years ago, so I really hope they have something else in the works by now.


Thus far I've heaped praise and scorn in equal measures, so lets get to the nitty gritty.


Car

Base price ($)

0-60mph (s)

Range (miles)

Safety

Tesla Model S

69,900

4.2

265

✭✭✭✭✭

Chevy Spark

27,495

7.6

82

✭✭✭✭

Nissan Leaf

28,800

9.8

75

✭✭✭✭✭

BMW i3

42,275

7.0

80

✭✭✭✭✭

Ford Focus EV

39,995

9.5

76

✭✭✭✭✭

Smart Electric

25,750

22.4

65

✭✭✭✭

Fiat 500e

32,500

9.1

87

✭✭✭✭✭

Toyota RAV4 EV

49,800

7.0

103

✭✭✭✭

Mitsubishi iMiEV

29,125

11.9

62

✭✭✭✭

Honda Fit

36,625

8.4

70

✭✭✭✭

Renault Zoe

27,250

8.2

60

✭✭✭✭✭

Rimac Conc. 1

980,000

2.8

300

NA

Tesla Roadster

109,000

3.7

244

NA


In the above table, the safety rating is poorly resolved. It's worth noting that your actual outcome in a two car collision is highly dependent on your mass. The Tesla weighs more than an SUV, and has, so far, hit a Honda Accord, a power pole, and a restaurant and won. Most of the other electric cars are compacts or sub-compacts, and their safety rating should be taken as such. It was during consideration of the Tesla Model S's safety tests that I realised the sense in which the BMW i3 and the Tesla are actually comparable.


The resemblance is uncanny.


A brief note on Tesla's technology. Almost all of Tesla's competitors use third party systems provided by either AC Propulsion or A123 systems. The same A123 whose exploding batteries caused it to enter bankruptcy. They re-registered the company as B456, not realising of course that B456 is a common fire extinguisher specification. How apt.

On the other hand, Tesla has a bunch of its own IP on technology. Not wanting to be hamstrung when ramping up volume, they developed technology that does not depend on rare-earth materials, heavy batteries, or any other highly specific technology. Their battery packs are made of around 7800 laptop cells. Instead of large, expensive and specific 'automotive' batteries, the 18650 package provides the benefits of enormous mass production, scaleability, and statistical reliability. Coupled with intelligent battery management software, a much more versatile pack results. When performance degrades, problematic cells can be substituted robotically, giving a cheap upgrade. The Tesla battery pack also forms part of the car's chassis, increasing stiffness and also providing for battery swapping capability. Each cell provides 3100mAh of electricity at 3.7V, and together the battery can provide 1200A at around 340V, delivering 310kW to the powertrain. In charging it can accept 120kW (at around 250A) for a ~40 minute charge.


When optimizing electric motors, the usual approach is to use high voltages and thin wires, combined with powerful magnets. Tesla uses a liquid cooled AC induction motor. It doesn't have permanent magnets, and thus its power depends on high current. The Tesla motor is optimised for low voltage, high current, and high torque, something the battery pack can readily provide.


Of the many innovations developed in the Model S, the last I'll present is the user interface software. Tesla uses a large touch screen to operate everything except the hazard lights and the glove compartment. Software updates can be downloaded via mobile networks. The car can be upgraded, fixing issues, adding functionality, and altering the mood with time. The modular, software-based approach will redefine the usual lifecycle of a car as a consumer product.


With any luck, we'll see these obvious (in hindsight) ideas applied in future cars across the industry. But what does the future hold for Tesla?


Going forward, Tesla plans to ramp production of the Model S to meet demand in Europe, North America, and Asia. Starting late 2014, Tesla will begin production and delivery of the Model X crossover. Based on the Model S chassis though somewhat longer and taller, the Model X will seat 7 adults and their luggage, and leverage continuing advances in battery technology for a similar range. The Model X will have an AWD option, which will also flow to the Model S, and may see its 0-60 time reduced even further.


Further ahead, Tesla plans to bring a third generation vehicle(s) to market in about 2017. Based around a smaller common chassis and starting at $35,000, these cars will be produced at a rate of half a million per year, aiming for about 5% of global market share.

Wednesday, September 18, 2013

Landing (softly) on Mars

Landing on Mars? How hard can it be? Simply drop over the planet, pull the parachute, and coast gently to the surface.

If only!

NASA now has quite a good track record on Mars landings. Something like 50% of attempts have been successful. That said, let's not tempt fate. Noone else has made a successful landing, despite many tries from both Russia/USSR and the ESA. Regular readers may know of my enthusiasm for manned Mars exploration/colonization, and so as a partial followup of a previous blog on the topic, I decided to crunch the numbers on surviving the impact.

First, a general discussion of the problem, as it applies to any prospective mission, robotic or manned.

On a typical (180 day free-return) Earth-Mars trajectory, the spacecraft arrives at 6000m/s. Most of this is due to Martian gravity pulling you in. This is roughly 21600km/h, or 13400mph. Really fast. But not quite as fast as re-entering spacecraft from low Earth orbit, and we're getting reasonably good at that.

The entry angle is somewhere between 4 and 7 degrees from the horizontal. Too deep and you'll make a nice crater, too shallow and you'll either bounce off and starve to death, or skip through the atmosphere and accidentally land waaaay too far from your target area. Possibly also making a crater. This is actually a really difficult problem, so lots of effort has been expended on precisely controlling the angle of entry. To attain an accuracy of only one degree, you need to enter through a window only 5km high. Fortunately, the craft is able to 'fly' a bit in the atmosphere and can land with better precision than you might otherwise think. The recent Mars rover landed damn close to the center of its 20km x 7km landing ellipse, and that's set the bar for what's currently achievable.

Previous successful surface missions have used airbags and/or parachutes to land. Unfortunately a manned craft is much too big to use a parachute, or a skycrane. The reason for this is that Mars' thin atmosphere necessitates a much faster, larger parachute, and no-one has any idea how to make a big enough parachute that can survive being opened at Mach 3. So my analysis assumed extensive use of landing rockets. This is the same approach mooted for the SpaceX Red Dragon concept. I compared the publicly available numbers with the numbers I got from my analysis and they were suspiciously close. Fortunately, supersonic rocket deployment can be tested in the Earth's upper atmosphere, which is much cheaper and faster than trying it on Mars.

After entering the atmosphere at an altitude of roughly 70km, air friction heats the spacecraft and slows it down. If you enter at the right angle, you'll reach terminal velocity, which is typically around 700m/s for the spacecraft in question. To put this in perspective, terminal velocity in Earth's atmosphere might be as high as 70m/s for a sufficiently heavy object. Sound travels at 340m/s on Earth, and about 250m/s on Mars. Oddly enough, the lower sound speed is more due to the higher density to pressure ratio due to temperature than just the low density of the atmosphere. For reference, the mean atmospheric density on Mars is about 1/200th that of Earth at the surface, though the scale height is greater due to low gravity. Still, it's real thin!

So, then, a typical free-fall re-entry profile might look something like this (scale in meters): 

The capsule enters from the top left and follows a nearly straight path to about 15,000m, at which point it levels out a bit, then plunges into the ground leaving a smoking crater 100m across for future, more successful explorers to visit. In future images, I'm going to change the aspect ratio a bit to help differing paths become more obvious, but it's important to remember how shallow this is.

The effect of different entering angles (varying from 4.5 to 7.5 degrees) can be seen here: 

Likewise, seasonal variation in atmospheric density gives the following trajectories:

There are some other parameters to take care of. Mars surface gravity is 3.71m/s/s, or 38% of Earth's. Then there are the spacecraft parameters. I selected parameters based on the previous post, of a manned MCT. It has a heat-shield radius of 5m. It arrives with a pessimistic mass of 56T, assuming that fuel is already running low, with only 14T (instead of 16T) remaining. 42T of hardware and people are to make it to the surface. It has a drag coefficient of about 1.5. Calculating this number is really difficult, but all blunt cone bodies (such as Apollo, Dragon, Soyuz, etc) have a drag coefficient between 1.45 and 1.6 over a large range of (supersonic) velocities, so 1.5 is about right. 

The lift coefficient, or lift-to-drag ratio is less straight forward. And has a tendency to be miscalculated. But calculating the lift coefficient of a particular spaceship is not our concern here. We will specify one, and the design should deliver. A good glider has a lift coefficient of about 30, which translates roughly to its glide slope. The concord had a supersonic lift coefficient of around 7, which is pretty close to optimal. But we're not designing a winged vehicle here. In fact, the only reason spacecraft are given a bit of lift is to decrease re-entry forces on the astronauts. For a ballpark, the Soyuz has a lift coefficient of 0.12. MSL had 0.24. Apollo was about 0.35, though that was higher than the designers intended. Dragon is 0.18. Many spacecraft jettison weights to lose their lift before parachute deployment, but that is both difficult and not strictly necessary in the MCT scenario, so I've left the lift in. Lift is generated due to an offset between center of drag and center of mass.

Here is a graph of unpowered impact velocities as a function of lift coefficient (entry angles of 5, 6, and 7 degrees).

As you can see, the first dip occurs between 0.175 and 0.19. Ultimately the rockets are fired some time before impact, but 0.18 is damn close to optimal for this particular atmosphere, and was fixed for the other functions. As long as the sidewall angle of your cone is within the bowshock, then the flight is stable. For 0.18, this means the sidewall has to be less than 10 degrees. Dragon has 15 degrees, and still gets slightly scorched when re-entering Earth's atmosphere.

ROCKETS! The MCT/Red Dragon is fitted with 4 pods on the cone's side, which can produce upward force. In the previous blog, I assumed that the rockets would be changed from hydrazine to methane, which gives you an efficiency boost. For this calculation, however, I assumed that the thrust would remain fixed at 67kN per engine, or 576kN for 8 engines on full throttle (ignoring cosine losses). The MCT is equipped with 12, so some redundancy remains. At full throttle, 8 engines can deliver an effective acceleration of just less than one earth g, though this increases as fuel is burned and mass decreases. Using rockets to remove the last 600m/s of speed will take about 66s (not including Mars gravity). With 14 tonnes of fuel, there is 76 seconds of time on full power. Fortunately the lift of the craft can be leveraged to increase the overall efficiency, otherwise you might always land with about 2s of fuel remaining. 

Assuming a vertical drop at a given speed, there is a relationship between height and acceleration needed to remove all velocity by the time of impact. Using an acceleration corresponding to about 70% of full power defines a reasonably broad flight path which the spacecraft, when it activates its engines, can automatically fly to. Obviously the actual rockets use more sophisticated algorithms, but mine is written in 5 lines. The latest rover's landing algorithms were written with about 500,000 lines of code. 

To walk you through the full re-entry process, the spacecraft falls towards Mars, aiming for a tangential encounter, about 60km off the surface. At 70km off the surface, atmospheric friction becomes comparable to gravitational acceleration. The spacecraft falls through the atmosphere, flying slightly with its tiny lift. At about 15,000m that flight begins to level off as the atmosphere thickens. Velocity continues to decrease, and lift eventually drops. At about 6000m, the rockets kick in. Initially firing on full, they quickly decelerate the craft to the planned flight path, at which point the rockets throttle back and gently lower the spacecraft to the ground. Velocity and altitude go to zero at the same moment for a soft landing. While under powered flight, a large degree of lateral movement is possible to avoid landing on any large boulders or other hazards.

Simple, huh? Here are the results. In these simulations, I've tweaked the altitude at which the rockets kick in. Obviously a more sophisticated algorithm would use a combination of altitude, velocity and acceleration to help land more precisely, but this is a simple handle, and easy to turn.

This graph shows the trajectories from activating the rocket between 4000 and 8500m. They split up slightly on the bottom right. But it's not immediately obvious which ones are survivable. Hint: about half of them aren't.

This graph shows the last 50 seconds of the set of trajectories firing up at 4000, 4100, 4200, and so on up to 8500m. Each dot represents the position every 2 seconds. 
On the left, we have trajectories that started too soon, run out of fuel, and then fall to the surface. On the right are the trajectories that start too late and don't slow down enough before hitting the surface. In an actual mission, they would activate all 12 engines for a larger set of survivable situations. In the middle, the dots are spaced more closely as they approach the ground - the spacecraft is descending in a controlled fashion. The survivable trajectories land within 5km of each other, giving one estimate of landing site choice range.

This graph shows remaining fuel mass vs impact velocity. Due to constraints on the numerical solver, 20m/s was the minimum velocity deliverable. While survivable, 1m/s is probably a better speed to hit the ground at.
At the bottom left, the craft land with up to 2.2T of fuel remaining (and 2T already subtracted for buffer or crazy midcourse corrections). To the right represent crashes with fuel remaining but insufficient time to decelerate. On the left running up the vertical axis, empty craft that fired too soon have fallen to the surface.

Log velocity vs time. 
Starting at about 6000m/s on the left, the velocity decreases due to air resistance. At around 230s, the rockets kick in hard. At about 270s, they throttle back to lower the craft gently to the surface and avoid taking off again. At the far right, 3 whiskers show the consequences of running out of fuel and falling.

A graph of acceleration vs time. 
The graph is 7gs high, so the crew has to endure a peak acceleration of about 6gs for 20s or so. The graph is normalized so that the spacecraft resting on the surface between 270 and 290s are at zero acceleration, even though they are experiencing one Mars g. The acceleration jumps up when the rockets are turned on, reduces as they assume the flight path, and heats up again for the landing. The usual edge cases are also visible.

Graph showing velocity vs altitude for the last 100 seconds of flight. Trajectories start at the top right, then travel to the bottom left. 
On the top right are common trajectories representing freefall. Parallel sloping lines represent hard rocket power, falling to the bottom sideways parabola, which is the flight path. Most of these smoothly tend to zero, representing a successful landing. The edge cases either hit the ground having never reached the flight path, or fall off the flightpath due to fuel shortage. Obviously you'd want to be somewhere in between, reaching the point of powered slow descent at between 1000 and 2500m altitude. I think this is the prettiest graph.

Graph of impact velocity vs altitude of rocket activation.
This graph has the good news. Even re-entering with low fuel, there is a wide window of acceptable altitudes at which activating the rockets will prevent death. Well, the capsule falls from 7400m to 5000m in about 10 seconds, but that's still plenty of time.

Finally, to revisit the question of optimal entry angle. A graph of impact velocity vs rocket altitude and entry angle.
Modern guidance systems can manage entry angles to within a fraction of a degree. But even with an uncertainty of a degree either way, low fuel, and questionable landing algorithms, there is still a broad valley of acceptable altitudes of rocket firing between 5000 and 7000m. 

This work does NOT study the validity of large heat shields or the stability of supersonic rocket thrust, but it does demonstrate that no-parachute powered landings with human cargo margins of error are very doable, and without any new technology.

Wednesday, September 4, 2013

Hyperloop grapevine corridor alternatives genetic algorithm

Oh dear, another technical blog post! But first some other stuff.

I went sailing with the lovely P and friends last Sunday from Long Beach toward Catalina and back. Just as everyone else was starting to look pretty green, we saw a bunch of whales. One humpback came up next to the yacht. He or she was much bigger than our measly 34 foot yacht. We also saw many dolphins and a few sea lions and even a sun fish.

Back to technical stuff!

For those of you not following the tech blogs, the hyperloop is a blue-sky proposal recently made by everyone's favourite CEO, Elon Musk (of Tesla and SpaceX). Disappointed with the expense and slow speed of California's proposed high speed rail network, he came up with an innovative concept. After a year of hints and getting suggestions from his own employees, he finally released a whitepaper on the topic: http://www.spacex.com/sites/spacex/files/hyperloop_alpha.pdf . I recommend reading the first few pages at least.

The basic idea is you have a steel tube running from LA to San Francisco. Inside, it is pumped down to a thousandth of an atmosphere. A long, skinny capsule has an electric compressor on the front which pumps air into air bearings on the base, which allow it to move almost frictionlessly, like an air hockey table. At each end, an electromagnetic motor accelerates and decelerates the capsule. In between, the capsule can get quite close to the speed of sound before the airflow around it chokes and the efficiency decreases. The whole thing is powered with solar panels and runs on elevated pylons, and would allow a trip from both city centers of about 35 minutes, running mainly along the 5 expressway down the California central valley.

Part of the open-source approach is to ask various members of the community for suggestions and improvements. One major problem which bugged me was the part where the tube has to pass the mountains between Santa Clarita and Tejon Ranch. This part of the 5 is known as 'The Grapevine', and it's a rather twisty expressway. If the hyperloop went through there at its designed speed of 1200 km/h, occupants would experience 20gs of acceleration, which would probably be pretty final. Some of the curves have to be taken out, either with tunnels, bridges, or alternative routes.

I decided to attack this problem. The most interesting technical hitch was when I was using the google maps API to get elevation data, it eventually got fed up with requests and locked me out. So I downloaded the raw file from the USGS and had more elevation data than I knew what to do with! I have no experience in transport corridor planning, so had to make up stuff as I went along.

What I settled on was a genetic algorithm. Genetic algorithms are generally the second best algorithm to solve any problem. I start with a family of parametrized curves representing possible paths, and then evolve them using a cost function based on pylon heights, tunnel lengths, minimum radii of curvature and maximum grade. Costs were taken either from the hyperloop whitepaper or from typical industry costs for similar projects.

One such run of the algorithm found the following corridor, which I wasn't expecting. Here it is in relief and profile (scale in meters). It runs mostly just to the north of the 5 route.

To people unfamiliar with southern California geography, the above box maps the 34N 118W graticule. At the top left is the southern extreme of the central valley and the intersection of the Garlock, San Andreas, Line Pine, and San Gabriel faults. At the bottom is the Santa Monica mountains, including the Malibu peninsula. The top right the Mojave basin/desert, and the bottom right is the LA basin.

The flat bit at about 62000m is Castaic lake and dam wall.

Key numbers:
Minimum curvature: 14.5km
Maximum speed: 266m/s = 960km/h = 600mph
Transit time: 345s (vs 435 for the whitepaper)
Length of tunnels: 20 miles.

The algorithm also spat out a lot of other answers, some of which were possibly useful. As always, a risk with genetic algorithms is that it will give you what you asked for, even if you asked for the wrong thing. At one point, my fitness function overvalued a straight track and undervalued the cost of tunneling, and I was rewarded with a tunnel from one end to the other! At other times, routes were returned with loops in funny places, sections hundreds of meters from the ground, etc.

The work involved in this blog took a couple of hours over the last few weeks. It's much less technical and much more accessible than my regular research, about which I have been unsuccessfully attempting a blog post for more than a year. Enjoy!