
Landing on Mars? How hard can it be? Simply drop over the planet, pull the parachute, and coast gently to the surface.


If only!
NASA now has quite a good track record on Mars landings. Something like 50% of attempts have been successful. That said, let's not tempt fate. Noone else has made a successful landing, despite many tries from both Russia/USSR and the ESA. Regular readers may know of my enthusiasm for manned Mars exploration/colonization, and so as a partial followup of a previous blog on the topic, I decided to crunch the numbers on surviving the impact.
First, a general discussion of the problem, as it applies to any prospective mission, robotic or manned.
On a typical (180 day free-return) Earth-Mars trajectory, the spacecraft arrives at 6000m/s. Most of this is due to Martian gravity pulling you in. This is roughly 21600km/h, or 13400mph. Really fast. But not quite as fast as re-entering spacecraft from low Earth orbit, and we're getting reasonably good at that.
The entry angle is somewhere between 4 and 7 degrees from the horizontal. Too deep and you'll make a nice crater, too shallow and you'll either bounce off and starve to death, or skip through the atmosphere and accidentally land waaaay too far from your target area. Possibly also making a crater. This is actually a really difficult problem, so lots of effort has been expended on precisely controlling the angle of entry. To attain an accuracy of only one degree, you need to enter through a window only 5km high. Fortunately, the craft is able to 'fly' a bit in the atmosphere and can land with better precision than you might otherwise think. The recent Mars rover landed damn close to the center of its 20km x 7km landing ellipse, and that's set the bar for what's currently achievable.
Previous successful surface missions have used airbags and/or parachutes to land. Unfortunately a manned craft is much too big to use a parachute, or a skycrane. The reason for this is that Mars' thin atmosphere necessitates a much faster, larger parachute, and no-one has any idea how to make a big enough parachute that can survive being opened at Mach 3. So my analysis assumed extensive use of landing rockets. This is the same approach mooted for the SpaceX Red Dragon concept. I compared the publicly available numbers with the numbers I got from my analysis and they were suspiciously close. Fortunately, supersonic rocket deployment can be tested in the Earth's upper atmosphere, which is much cheaper and faster than trying it on Mars.
After entering the atmosphere at an altitude of roughly 70km, air friction heats the spacecraft and slows it down. If you enter at the right angle, you'll reach terminal velocity, which is typically around 700m/s for the spacecraft in question. To put this in perspective, terminal velocity in Earth's atmosphere might be as high as 70m/s for a sufficiently heavy object. Sound travels at 340m/s on Earth, and about 250m/s on Mars. Oddly enough, the lower sound speed is more due to the higher density to pressure ratio due to temperature than just the low density of the atmosphere. For reference, the mean atmospheric density on Mars is about 1/200th that of Earth at the surface, though the scale height is greater due to low gravity. Still, it's real thin!
So, then, a typical free-fall re-entry profile might look something like this (scale in meters): 

The capsule enters from the top left and follows a nearly straight path to about 15,000m, at which point it levels out a bit, then plunges into the ground leaving a smoking crater 100m across for future, more successful explorers to visit. In future images, I'm going to change the aspect ratio a bit to help differing paths become more obvious, but it's important to remember how shallow this is.
The effect of different entering angles (varying from 4.5 to 7.5 degrees) can be seen here:

Likewise, seasonal variation in atmospheric density gives the following trajectories:

There are some other parameters to take care of. Mars surface gravity is 3.71m/s/s, or 38% of Earth's. Then there are the spacecraft parameters. I selected parameters based on the previous post, of a manned MCT. It has a heat-shield radius of 5m. It arrives with a pessimistic mass of 56T, assuming that fuel is already running low, with only 14T (instead of 16T) remaining. 42T of hardware and people are to make it to the surface. It has a drag coefficient of about 1.5. Calculating this number is really difficult, but all blunt cone bodies (such as Apollo, Dragon, Soyuz, etc) have a drag coefficient between 1.45 and 1.6 over a large range of (supersonic) velocities, so 1.5 is about right.
The lift coefficient, or lift-to-drag ratio is less straight forward. And has a tendency to be miscalculated. But calculating the lift coefficient of a particular spaceship is not our concern here. We will specify one, and the design should deliver. A good glider has a lift coefficient of about 30, which translates roughly to its glide slope. The concord had a supersonic lift coefficient of around 7, which is pretty close to optimal. But we're not designing a winged vehicle here. In fact, the only reason spacecraft are given a bit of lift is to decrease re-entry forces on the astronauts. For a ballpark, the Soyuz has a lift coefficient of 0.12. MSL had 0.24. Apollo was about 0.35, though that was higher than the designers intended. Dragon is 0.18. Many spacecraft jettison weights to lose their lift before parachute deployment, but that is both difficult and not strictly necessary in the MCT scenario, so I've left the lift in. Lift is generated due to an offset between center of drag and center of mass.
Here is a graph of unpowered impact velocities as a function of lift coefficient (entry angles of 5, 6, and 7 degrees).

As you can see, the first dip occurs between 0.175 and 0.19. Ultimately the rockets are fired some time before impact, but 0.18 is damn close to optimal for this particular atmosphere, and was fixed for the other functions. As long as the sidewall angle of your cone is within the bowshock, then the flight is stable. For 0.18, this means the sidewall has to be less than 10 degrees. Dragon has 15 degrees, and still gets slightly scorched when re-entering Earth's atmosphere.
ROCKETS! The MCT/Red Dragon is fitted with 4 pods on the cone's side, which can produce upward force. In the previous blog, I assumed that the rockets would be changed from hydrazine to methane, which gives you an efficiency boost. For this calculation, however, I assumed that the thrust would remain fixed at 67kN per engine, or 576kN for 8 engines on full throttle (ignoring cosine losses). The MCT is equipped with 12, so some redundancy remains. At full throttle, 8 engines can deliver an effective acceleration of just less than one earth g, though this increases as fuel is burned and mass decreases. Using rockets to remove the last 600m/s of speed will take about 66s (not including Mars gravity). With 14 tonnes of fuel, there is 76 seconds of time on full power. Fortunately the lift of the craft can be leveraged to increase the overall efficiency, otherwise you might always land with about 2s of fuel remaining.
Assuming a vertical drop at a given speed, there is a relationship between height and acceleration needed to remove all velocity by the time of impact. Using an acceleration corresponding to about 70% of full power defines a reasonably broad flight path which the spacecraft, when it activates its engines, can automatically fly to. Obviously the actual rockets use more sophisticated algorithms, but mine is written in 5 lines. The latest rover's landing algorithms were written with about 500,000 lines of code.
To walk you through the full re-entry process, the spacecraft falls towards Mars, aiming for a tangential encounter, about 60km off the surface. At 70km off the surface, atmospheric friction becomes comparable to gravitational acceleration. The spacecraft falls through the atmosphere, flying slightly with its tiny lift. At about 15,000m that flight begins to level off as the atmosphere thickens. Velocity continues to decrease, and lift eventually drops. At about 6000m, the rockets kick in. Initially firing on full, they quickly decelerate the craft to the planned flight path, at which point the rockets throttle back and gently lower the spacecraft to the ground. Velocity and altitude go to zero at the same moment for a soft landing. While under powered flight, a large degree of lateral movement is possible to avoid landing on any large boulders or other hazards.
Simple, huh? Here are the results. In these simulations, I've tweaked the altitude at which the rockets kick in. Obviously a more sophisticated algorithm would use a combination of altitude, velocity and acceleration to help land more precisely, but this is a simple handle, and easy to turn.
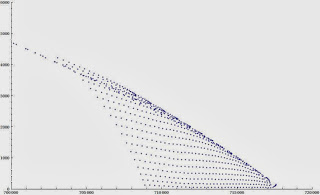
This graph shows the trajectories from activating the rocket between 4000 and 8500m. They split up slightly on the bottom right. But it's not immediately obvious which ones are survivable. Hint: about half of them aren't.

This graph shows the last 50 seconds of the set of trajectories firing up at 4000, 4100, 4200, and so on up to 8500m. Each dot represents the position every 2 seconds.

On the left, we have trajectories that started too soon, run out of fuel, and then fall to the surface. On the right are the trajectories that start too late and don't slow down enough before hitting the surface. In an actual mission, they would activate all 12 engines for a larger set of survivable situations. In the middle, the dots are spaced more closely as they approach the ground - the spacecraft is descending in a controlled fashion. The survivable trajectories land within 5km of each other, giving one estimate of landing site choice range.
This graph shows remaining fuel mass vs impact velocity. Due to constraints on the numerical solver, 20m/s was the minimum velocity deliverable. While survivable, 1m/s is probably a better speed to hit the ground at.

At the bottom left, the craft land with up to 2.2T of fuel remaining (and 2T already subtracted for buffer or crazy midcourse corrections). To the right represent crashes with fuel remaining but insufficient time to decelerate. On the left running up the vertical axis, empty craft that fired too soon have fallen to the surface.
Log velocity vs time.

Starting at about 6000m/s on the left, the velocity decreases due to air resistance. At around 230s, the rockets kick in hard. At about 270s, they throttle back to lower the craft gently to the surface and avoid taking off again. At the far right, 3 whiskers show the consequences of running out of fuel and falling.
A graph of acceleration vs time.

The graph is 7gs high, so the crew has to endure a peak acceleration of about 6gs for 20s or so. The graph is normalized so that the spacecraft resting on the surface between 270 and 290s are at zero acceleration, even though they are experiencing one Mars g. The acceleration jumps up when the rockets are turned on, reduces as they assume the flight path, and heats up again for the landing. The usual edge cases are also visible.
Graph showing velocity vs altitude for the last 100 seconds of flight. Trajectories start at the top right, then travel to the bottom left.

On the top right are common trajectories representing freefall. Parallel sloping lines represent hard rocket power, falling to the bottom sideways parabola, which is the flight path. Most of these smoothly tend to zero, representing a successful landing. The edge cases either hit the ground having never reached the flight path, or fall off the flightpath due to fuel shortage. Obviously you'd want to be somewhere in between, reaching the point of powered slow descent at between 1000 and 2500m altitude. I think this is the prettiest graph.
Graph of impact velocity vs altitude of rocket activation.

This graph has the good news. Even re-entering with low fuel, there is a wide window of acceptable altitudes at which activating the rockets will prevent death. Well, the capsule falls from 7400m to 5000m in about 10 seconds, but that's still plenty of time.
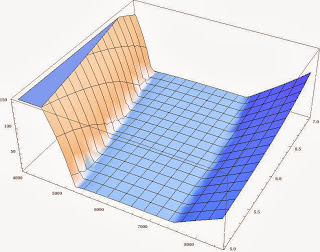
Finally, to revisit the question of optimal entry angle. A graph of impact velocity vs rocket altitude and entry angle.

Modern guidance systems can manage entry angles to within a fraction of a degree. But even with an uncertainty of a degree either way, low fuel, and questionable landing algorithms, there is still a broad valley of acceptable altitudes of rocket firing between 5000 and 7000m.
This work does NOT study the validity of large heat shields or the stability of supersonic rocket thrust, but it does demonstrate that no-parachute powered landings with human cargo margins of error are very doable, and without any new technology.


